Using graph theory to prioritize life goals
Most goal-setting advice focuses on how to achieve goals, instead of which goals even matter. Because let’s be real, some goals, while they feel important, are just not worth pursuing.
Here, I’ll share strategies I use to prioritize what matters most in life, based on principles from the Theory of Constraints that I use in my annual self-review when reflecting on “New Year’s resolutions” for the upcoming year.
There are already great resources like Atomic Habits with ample tactics to accomplish any goal you want, but this essay is one abstraction level higher than that, to help you select what goals to focus on in the first place.
Yearly goal-setting and self-reflection have been my favourite and most effective tools to help me live a considered, well-lived life, and I’ll try to help you prioritize competing goals relative to each other, because we only have so much time and energy (plus napping is important too).
Afterwards, you can take your top goal and execute it using any of the pre-existing productivity techniques out there.
Table of Contents
- Brainstorm life categories
- Rating each category
- Ranking each category
- Assigning an importance score
- Calculate neglectedness
- Calculate a dependency graph
- Go deeper into your top goals
- Gratitude
1. Brainstorm life categories
First, let’s break our lives down into broad categories; for example:
- Health and fitness
- Charity
- Family and relationships
- Career
- Money and personal finances
- Fun and adventure
- Physical location
- Material belongings
- Education and skill development
- Mental and emotional wellbeing
- Productivity and organization
- Character, integrity, and self-identity
These are a lot of categories! To stay focused, we’ll only consider a handful to limit the amount of time spent on this exercise, but you could choose to be more comprehensive if you have more time (or not, if you find it too annoying).
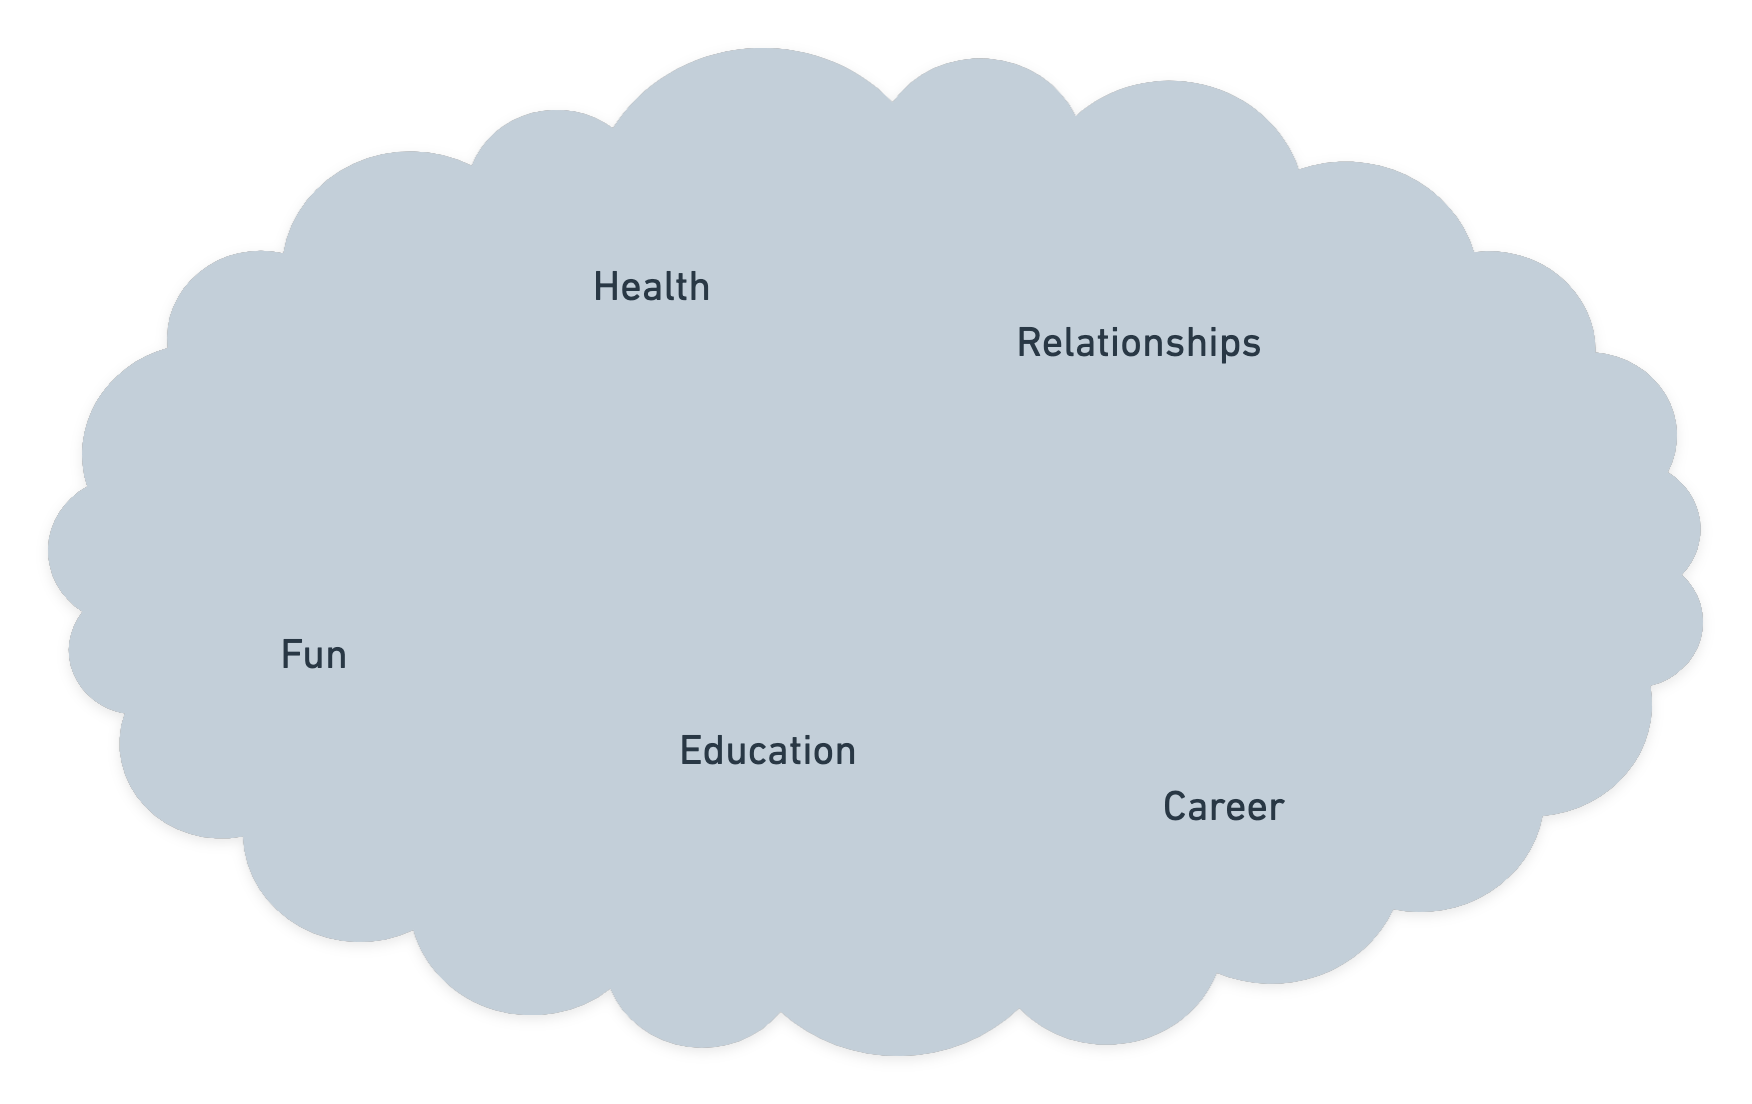
As an example, I’ll pick five categories that we can walk through together: Health, Relationships, Fun1, Education, and Career.
2. Rating each category
We’ll give each category a rating from 7 to 1.
That is, 7 is considered to be the worst rating, and 1 is considered to be the best rating. Yes, this is backwards from rating scales you normally use, for a good reason I’ll explain later.
I think I’m doing pretty well at Health and Career, but there are some specific things I’d like to improve, so I’ll give both of those a rating of 2 (a good rating). Relationships and Fun are doing OK so I’ll give those a rating of 3. Education is lackluster but not the worst so I’ll give it a rating of 4 (a bad rating).
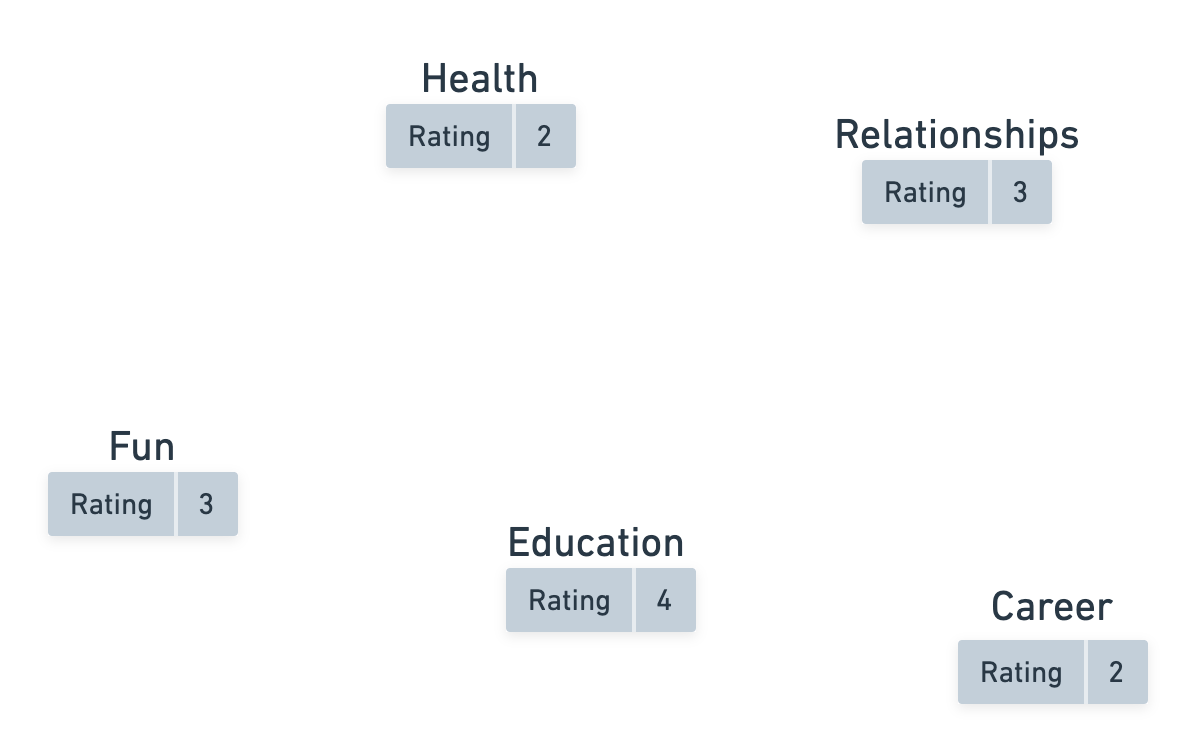 Health: 2, Career: 2, Relationships: 3, Fun: 3, Education: 4.
You’re allowed to give non-integer ratings, like 6.9 or 4.2, but I’ll stick to integer ratings to make the math easier for us.
It’s up to you if you want to assign your ratings subjectively: “This year I did so much work on myself and understand myself way better, so I’ll rate my Self-Identity at 1.1”, or objectively: “Last year I said I would publish 12 essays, but I only published 1, so my Writing rating is 6.5”2.
3. Ranking each category
Next, we’ll rank each category based on how important it is to you personally. We’ll give it a ranking from 1 to \(n\), where \(n\) is the total number of items. 1 is the most important category and \(n\) is the least important category. Here \(n=5\) because I picked 5 items, so the least important category gets a ranking of 5.
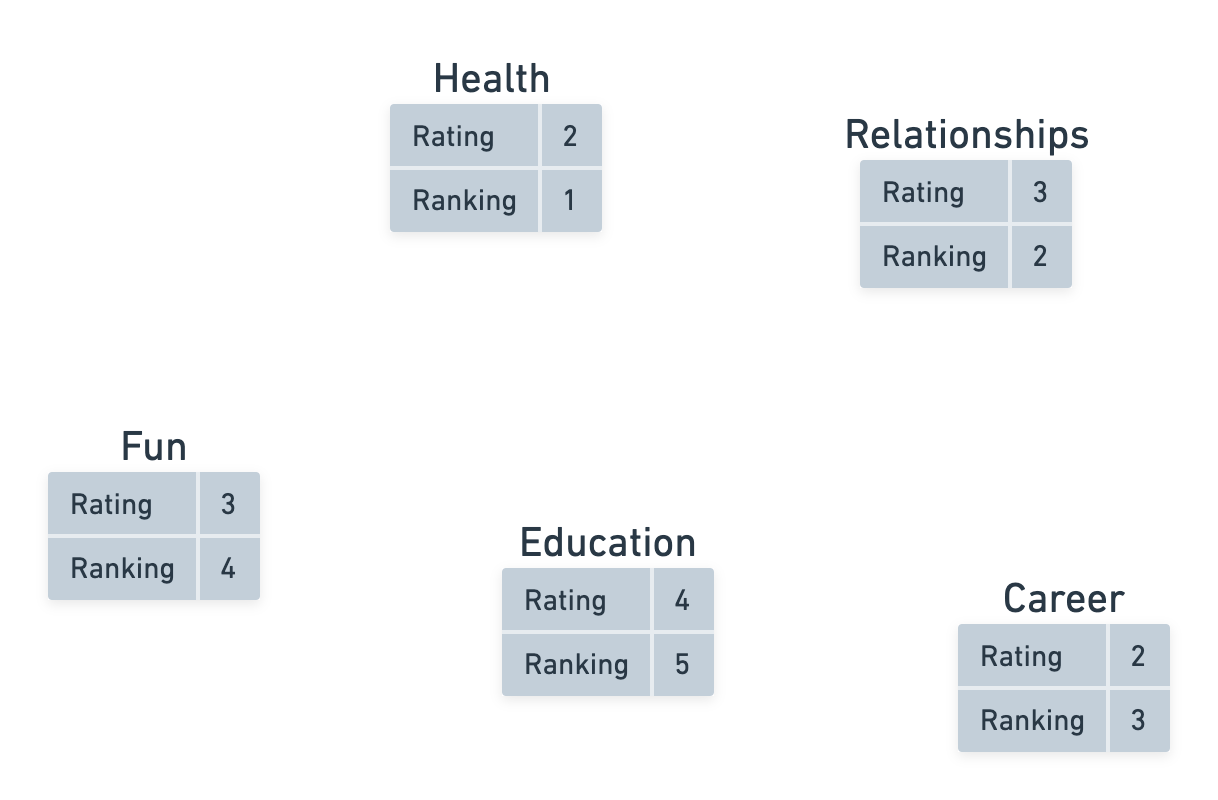 #1: Health, #2: Relationships, #3: Career, #4: Fun, #5: Education.
In this example, Health is ranked #1, the most important to me personally, and Education is ranked #5, the least important to me personally.
4. Assigning an importance score
Now, we’ll assign a relative, inter-category importance to each item. This is a separate score from the “Ranking” score, and we’ll call it an “Importance” score. We’ll start with the least important category (Education), and give it an Importance rating of 1.
Next, we’ll take the second least important category (Fun), and ask “how much more important is Fun, compared to Education?” I think Fun is 200% more important (aka 3 times more important) than Education, so I’ll give Fun an importance rating of 3.
Next, take the third least important category (Career) and ask “how much more important is Career, compared to Education?” I think Career is 66% more important than Education, so I’ll give Career an importance rating of 5, which is 66% more than 3.
Continue this relative importance ranking until you finish assigning an importance score to all your categories. Here’s my result:
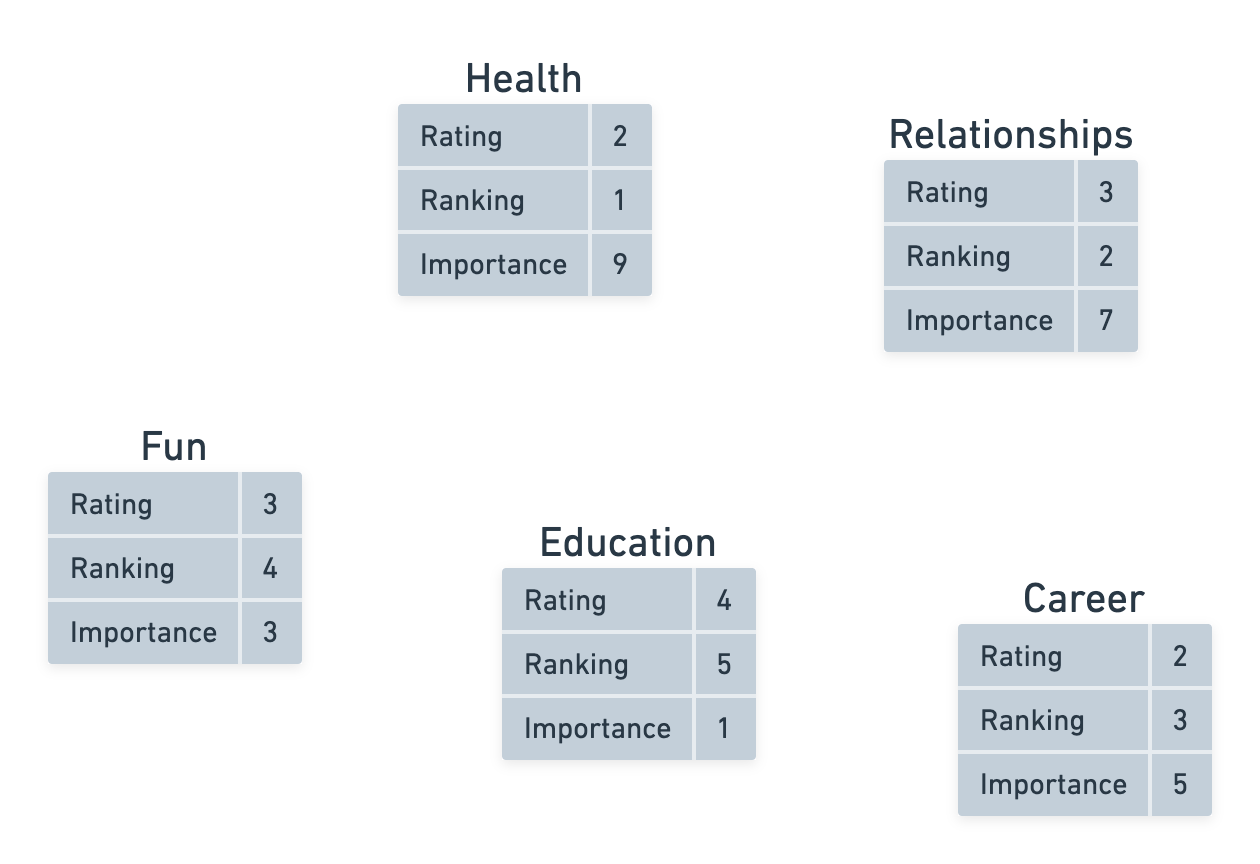 Education: 1, Fun: 3, Career: 5, Relationships: 7, Health: 9.
I used integer scores here to make the example easier to explain, but in practice, you’ll end up with importance ratings that look like 1.3 or 2.75.
The minimum importance score is 1 (your least important category), and there is no maximum importance score. Any category can be as important as you want it to be; what matters is the relative comparison between importance categories.
Pause and reflect
Let’s stop here to compare the importance rankings we’ve assigned.
One way to reflect on the importance ratings is to ask yourself a series of probing questions about what it means for a category to be \(x\)% more important.
For example, if Career is 5 times more important than Education, it means if I earn $100 an hour at my job I should be unwilling to stop working and go back to school unless going to school raises my wages to more than $500 an hour.3 If Health is 3 times more important than Fun, it means that instead of spending 3 hours playing board games on the weekend, I should be willing to trade that entire activity for 1 hour of going to the gym. If these “feel wrong”, then I’ll reconsider and adjust my scores.
Another technique is to step back and make additional pairwise comparisons. I did not originally directly compare Health to Fun, but I’ll notice that Health is rated as 3 times more important than Fun. I’ll reflect and ask myself “is that really the case?”, and if not I’ll tweak the number upwards or downwards until it “feels right” in relation to all the other categories.
5. Calculate neglectedness
Next, calculate a Neglectedness score by multiplying each category’s Rating by its Importance:
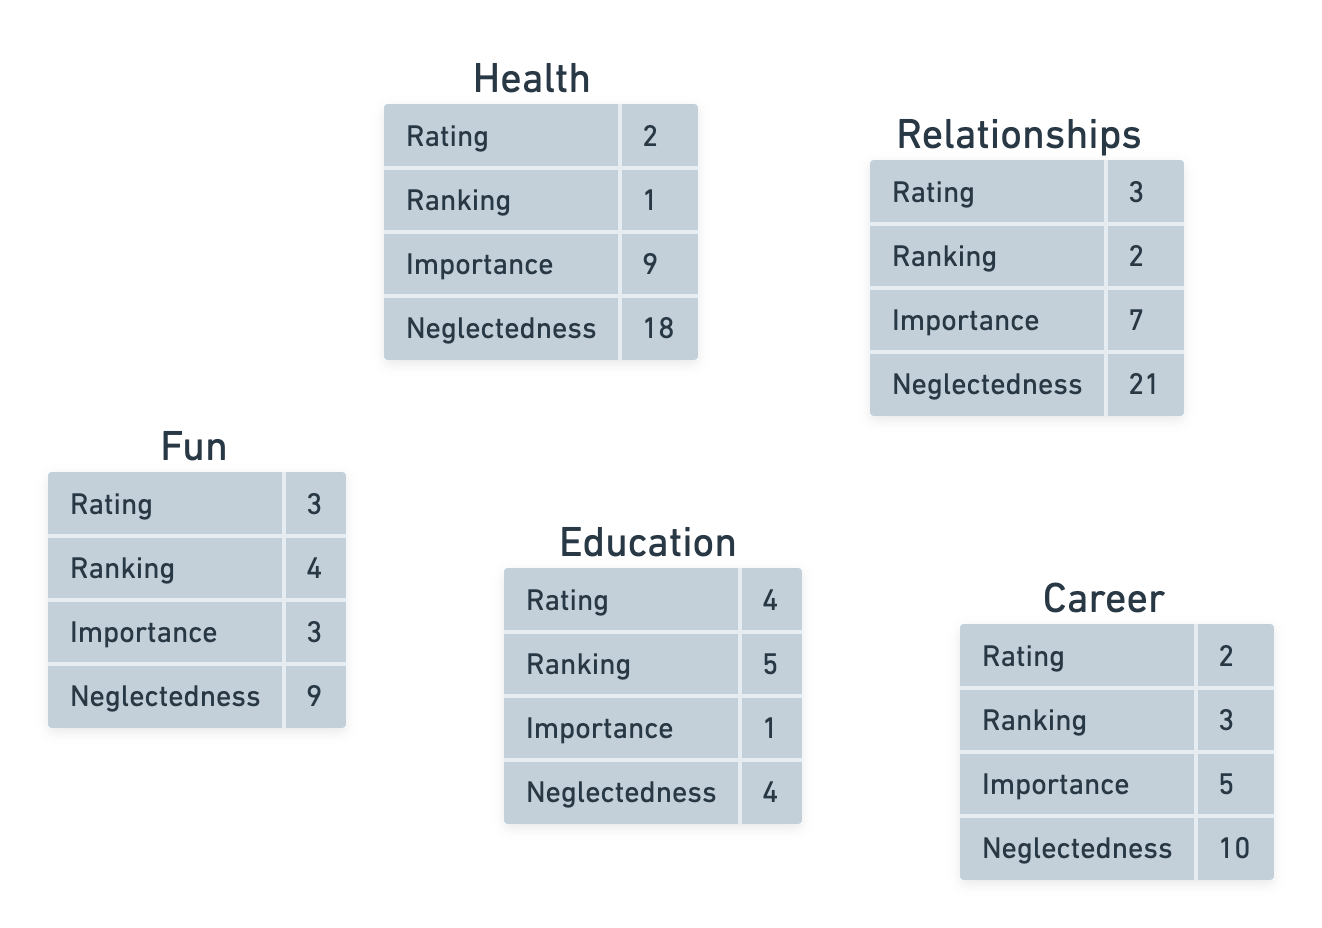 Health: 2×9=18, Relationships: 3×7=21, Fun: 3×3=9, Education: 4×1=4, Career: 2×5=10.
Neglectedness measures how much you’ve been “neglecting” this activity. The worse you are at it and the more important it is, the more neglected it is. This is why our rating scale was backwards, because a big Neglectedness score means you are both bad at it and the category is important to you.
Don’t interpret this judgementally on yourself, but instead as a spotlight of where you’ve historically put your energy, and an invitation to consider whether you want to continue down the same path or reallocate your energy into different categories.
Pause and reflect
I’d like you to dwell on how this calculation makes you feel, and if you notice anything different compared to how you intuitively ranked each category in the beginning.
In our example, I notice that I previously ranked Health as #1 and Relationships as #2, but now it appears that Relationships is actually more important than Health because Relationships has a Neglectedness score of 21, which is more neglected than Health with a lower Neglectedness score of 18.
The specific numbers here aren’t important—it isn’t meaningful that Health has a Neglectedness score of 18 and Fun has a score of 9. But it is meaningful that Health appears to be drastically more neglected than Fun—I didn’t expect this because I originally gave Health a better rating and ranked it 3 rungs ahead of Fun.
If this is not the result that you wanted, it’s not necessarily good or bad, this exercise simply highlights a direction to think about why your result came out the way it did. Maybe you’re doing better than you thought on one of the categories, or maybe it’s not as important as you thought it was. How do the results sit with you?
6. Calculate a dependency graph
Next, we’re going to think about which categories support other categories.
I notice I subconsciously ranked Health as #1 and Relationships as #2 not because they are objectively in that order, but because I subjectively think that good health is a prerequisite for having good relationships.
We’re going to make these prerequisites explicit by drawing arrows between dependent categories.
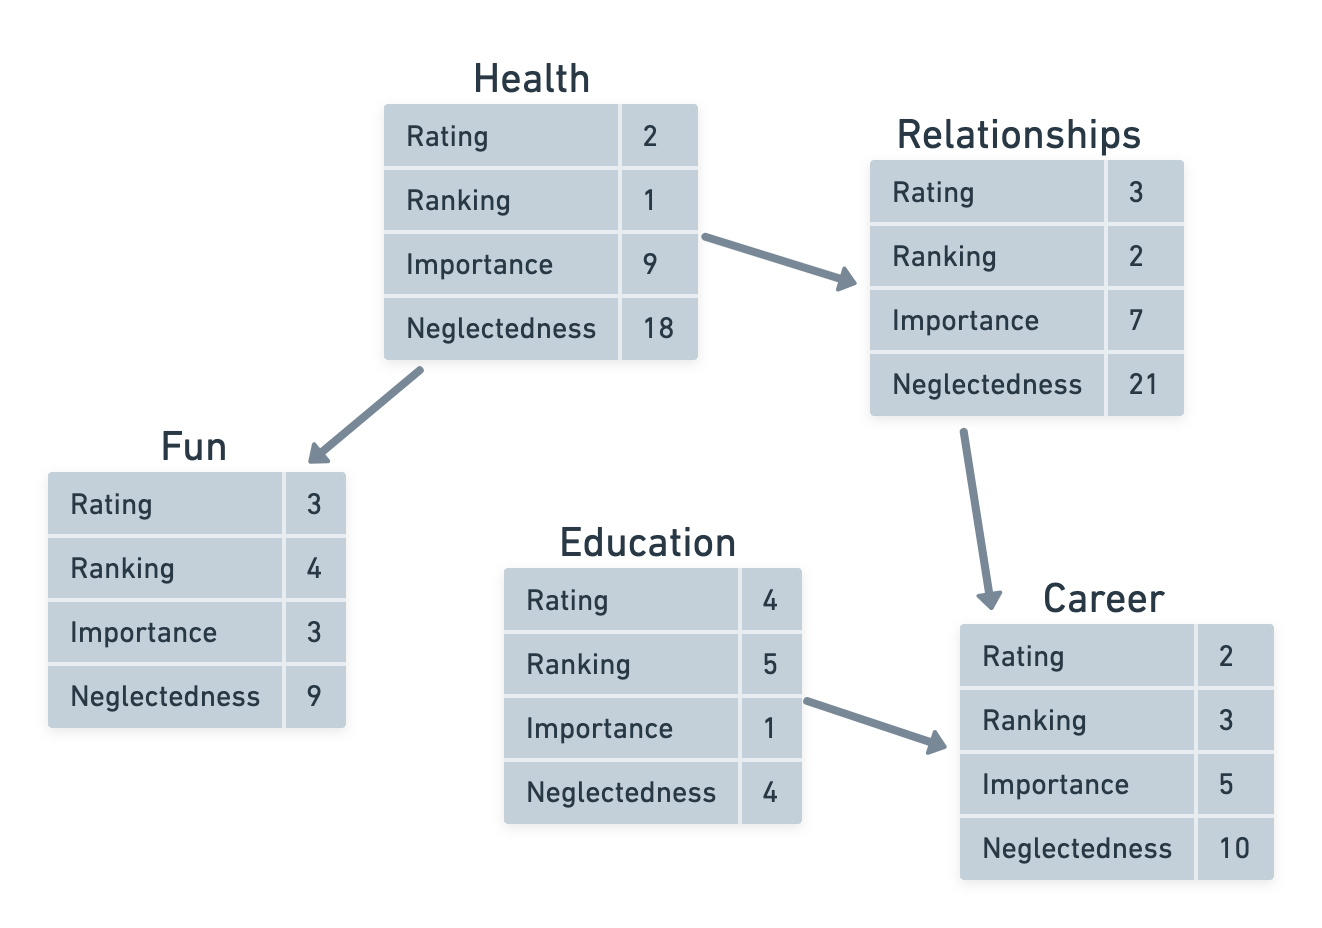
In this example:
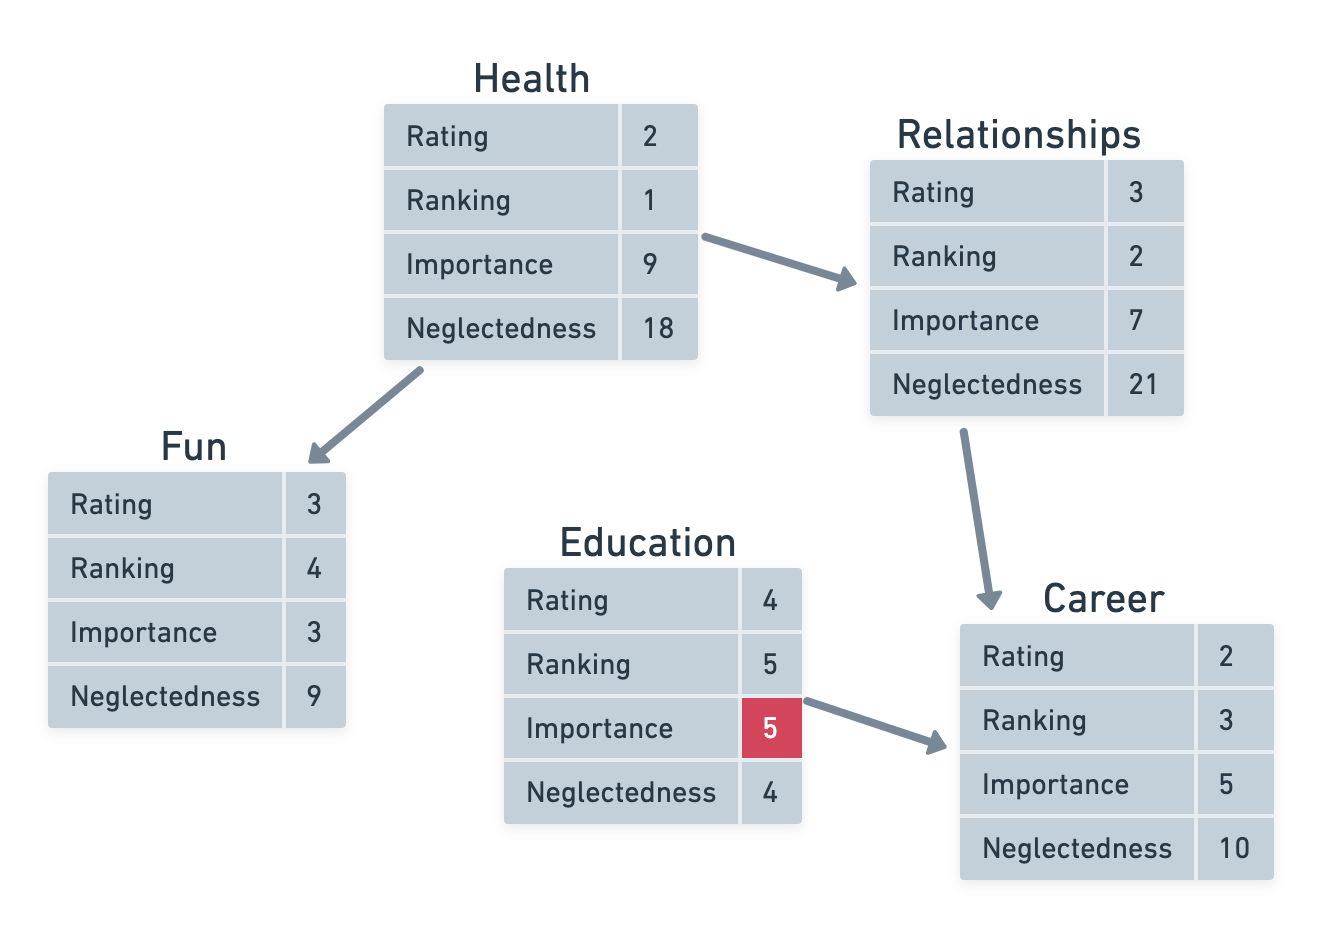
- I made Health required for Fun because maintaining good cardio fitness enables me to go hiking outdoors.
- I made Health required for Relationships because I need to be in good spirits to have quality time with my family and friends.
- I put Relationships as a dependency of Career because I need to have a strong social support network before I can be 100% present at work.
- I also put Education as a dependency of Career because I need useful and valuable skills before I can advance my career.
When drawing arrows, you’re not allowed to make a circular chain (or cycle).
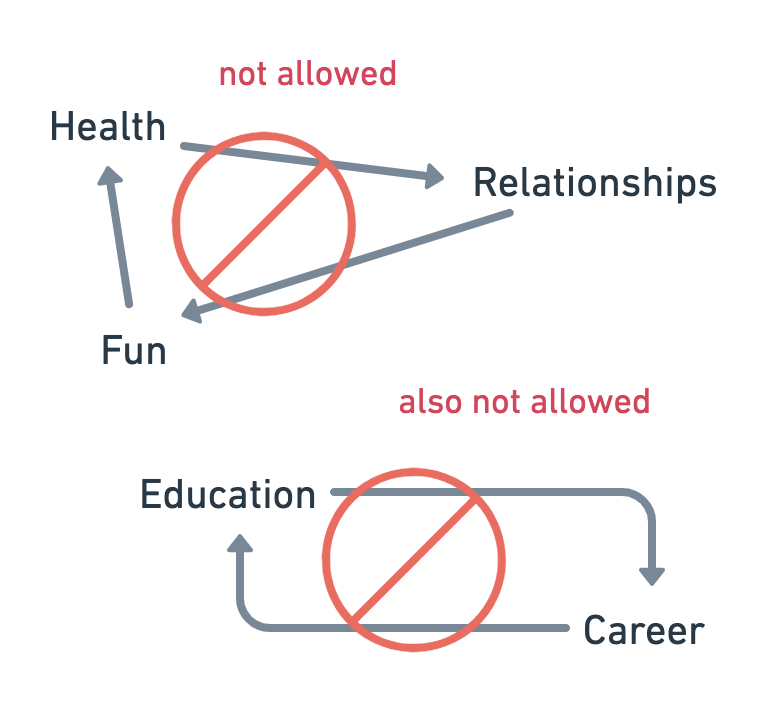 For example, you can’t make Relationships dependent on Health, Health dependent on Fun, and Fun dependent on Relationships. You also can’t make Education dependent on Career, and Career dependent on Education.
Next, we’ll do what feels like a magic trick to me 🪄✨ by recalculating our importance scores based on the dependent categories we just assigned.
Look at what arrows point towards and away from each category. You can start anywhere, but I like to start with the category that has the most incoming arrows and follow the arrows backwards to work my way through each category.
In this example, we’ll start with the category Career, because it has the most arrows pointing toward it.
Now, for every arrow pointing towards our chosen category, we’ll look at the importance number at the head of the arrow and compare it to the importance number at the tail of the arrow.
 In our example, Education has an Importance of 1, but it is a prerequisite to Career, which has an Importance of 5.
If the number at the tail of the arrow (the prerequisite, or upstream category) is less than the number at the head of the arrow (the downstream category), we’ll change the number at the tail to be the same as the number at the head.
 Since the upstream category (Education) cannot be less important than the downstream category (Career), we change the Importance of Education from 1 to 5, to match the importance of Career.
This makes it so that every category cannot be less important than anything which depends on that category. To be a “dependency” means that the upstream goal must be worked on first before you can achieve any downstream goals, so upstream goals must have greater or equal importance than all downstream goals.
For another example, Health has an Importance of 9 and it is a prerequisite to Relationships, which has an Importance of 7. Since 9 is greater than 7, no changes are required here.

Repeat this calculation for every category, for every arrow. The updated graph looks like this:
Finally, for every category whose importance has changed, we’ll recalculate the Neglectedness score by multiplying the category’s rating by its new importance:
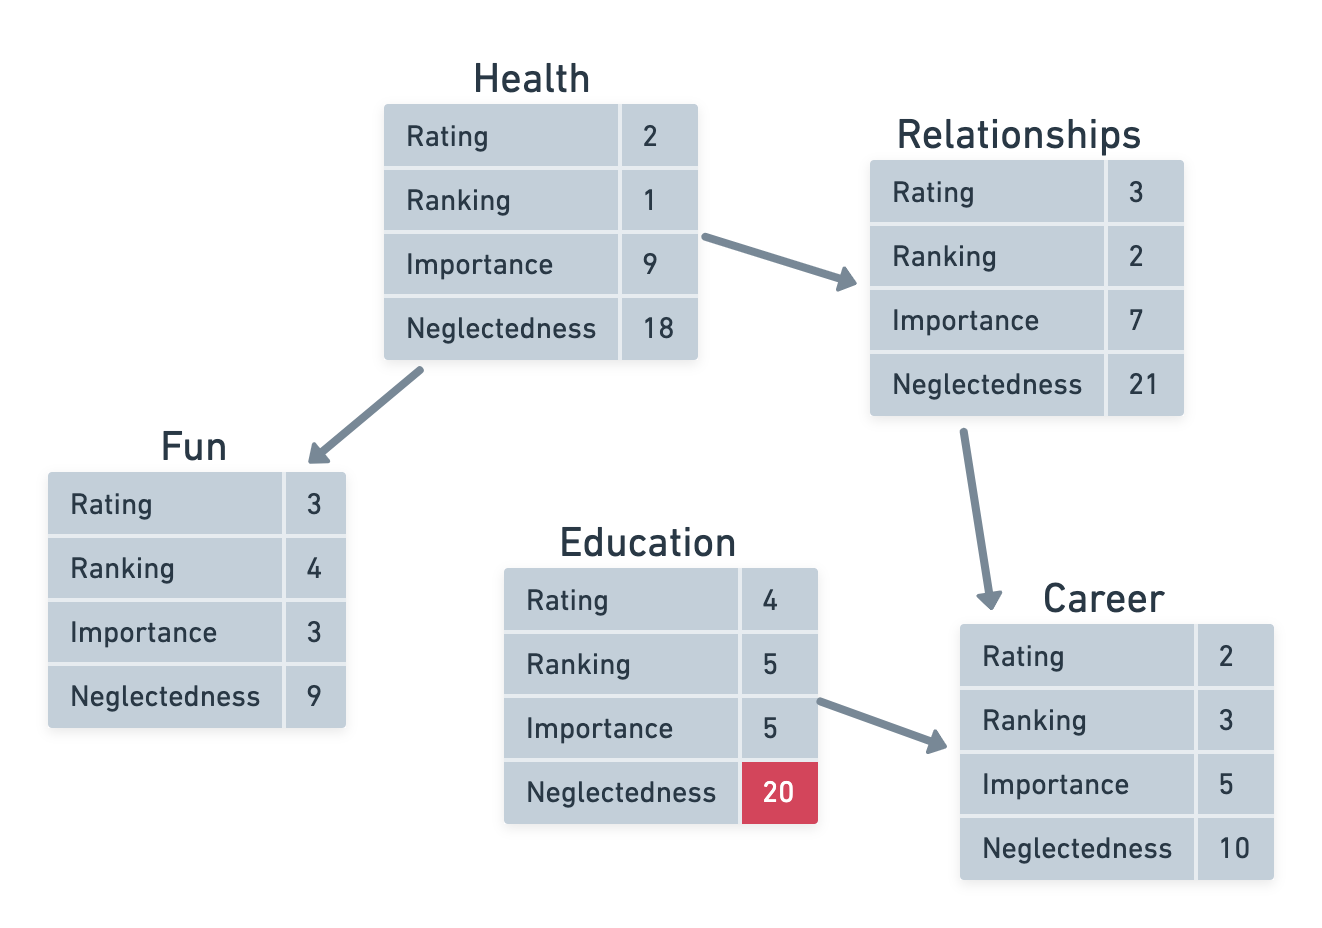 Education’s new Neglectedness: 20=4×5
Pause and reflect
Let’s pause again to reflect on our results. Notice what has changed: in my example, Education used to be the least neglected category, but after the update, it is now among the most neglected areas of my life!
Again, the specific numbers aren’t relevant, but the purpose of this exercise is to gain a different perspective and ask “how do you feel about your result?”
One insight I uncovered from this exercise is that Education is more valuable than I thought!
Coming into the exercise I felt Education wasn’t a priority because I already had sufficient skills, but I learned that it’s the rate-limiting factor for advancing my career—if I want to advance my career, I should actually focus on developing more skills, and not necessarily grinding harder at work.
Or, an alternative perspective/conclusion may be that Education isn’t as strong of a dependency for Career as I thought it was.
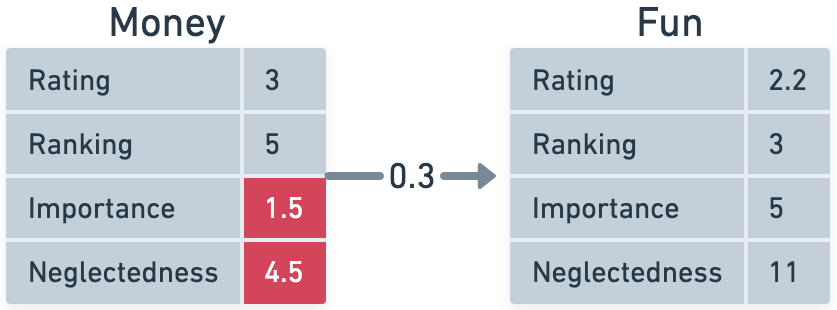
For math nerds 🤓, you could be more advanced by assigning numbers between 0 and 1 to the arrows to model weaker dependencies, where 0.2 represents a dependency that is only 20% required. Then, when recalculating Importance, the Importance number at the tail of the arrow has to only be greater than or equal to 20% of the number at the head of the arrow.
We can call the number on the arrow a weight, and the default weight (if you don’t change it) is 1, which will have the same calculation as before when we didn’t give custom weights.
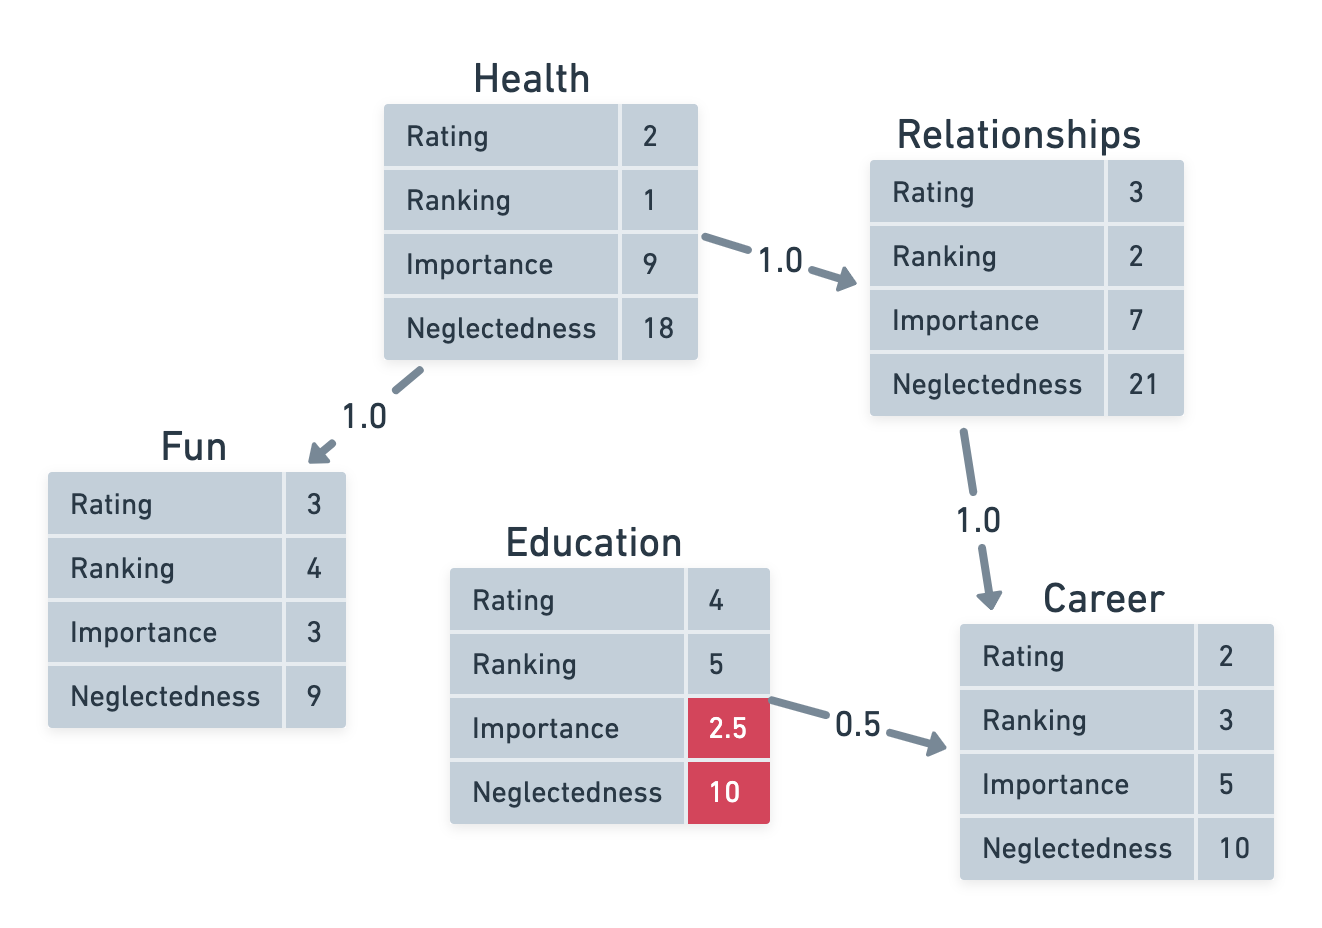 Education’s new Importance: 2.5=0.5×5, new Neglectedness: 20=4×2.5
In this example, I made the arrow connecting Education and Career take on a weight of 0.5. The rest of the arrows maintain their default weight of 1. As a result, the recalculated Importance for Education is 2.5 instead of 1, and its recalculated Neglectedness is 10 instead of 4, shunting it back to one of the least neglected categories again.
7. Go deeper into your top goals
Now that you have a stronger idea of the “top” areas of your life to focus on, let’s set some goals! I’ll reinforce again that the specific scores you got don’t matter—just because one category has the highest Neglectedness score doesn’t necessarily mean it’s the “top” area for you—this exercise was meant to give you a different way of looking at things, to help you trade goals against each other under ambiguity. Use it as one opinion, not the final opinion, on what your “top” goals should be.
Anyway, we can now take the “top” categories and break them down further into subcategories and set some goals using your favourite goal-setting framework. I won’t go into detail on how to set and achieve effective goals because there’s already plenty of literature on this topic, so I’ll leave the “how” as an exercise for the reader.
Here are some example sub-goals I came up with for this year:
Career
- Apply for promotion
- Mentor 3 junior engineers
Health
- Never miss a workout
- Increase VO2 max by 5 mL/kg/min in the next 6 months
- Increase 1 rep max deadlift to 400 lbs in the next 8 months
Fun
- Visit Rockport beach in the summer
- Before going to bed, instead of scrolling Hacker News, read a book or set aside time for mindfulness meditation
8. Gratitude
Lastly, we’ll conclude this exercise by thinking about some things in your life that you’re grateful for, and writing them down next to your prioritized goals.
When it comes to mapping out personal goals, and then cataloguing how badly you’ve been doing so far, it’s easy to get into an overly self-critical mood. Thus, to counteract this and make our self-reflection more balanced, we’ll close by reminding ourselves of all the things that are going great in our lives by recording our gratitude. 😊
Here’s what I came up with:
- I’m grateful for having a supportive, loving family and a circle of friends I respect and cherish.
- I’m grateful for my job and for getting to work on intellectually stimulating work with helpful, talented colleagues.
- I’m grateful for not needing to worry about my basic needs and being able to pay for a quiet place to rest and warm, nutritious meals.
That’s all for now! I only publish half of my writing publicly. If this essay helped you in any way, you can read the rest of my essays on my private email list, where I send articles that were too sensitive to share online: billmei.net/follow (Subscribing is free, no spam ever, and you can safely unsubscribe anytime)
Footnotes
-
I like explicitly making “fun” a goal because I find that if I don’t consciously plan my fun in advance, I’ll end up doing less fulfilling forms of fun like scrolling twitter instead of more fulfilling forms of fun like writing essays. ↩
-
\(6.5=\left(100\%-\frac{1}{12}\right)\times\left(7-1\right)+1\). The \(\left(7-1\right)\) is to resize into the given rating scale and the \(+1\) is to change from a zero-index into a one-index. ↩
-
I asked an LLM to “make this sentence funnier” and it came up with: “if Career is 5 times more important than Education, it means I’d rather be a clown making balloon animals for a living than go back to school unless I can become a brain surgeon and make $1000 an hour.” ↩
